Analytics
The Analytics section of the Imgix dashboard offers usage statistics for your account and Imgix’s service health, which updates every hour. You can use these to gauge your site or app’s monthly usage. For definitions of the terms, click the (?) icons in each section or check out the Glossary.
Here are some basic concepts to understand about Imgix’s analytics.
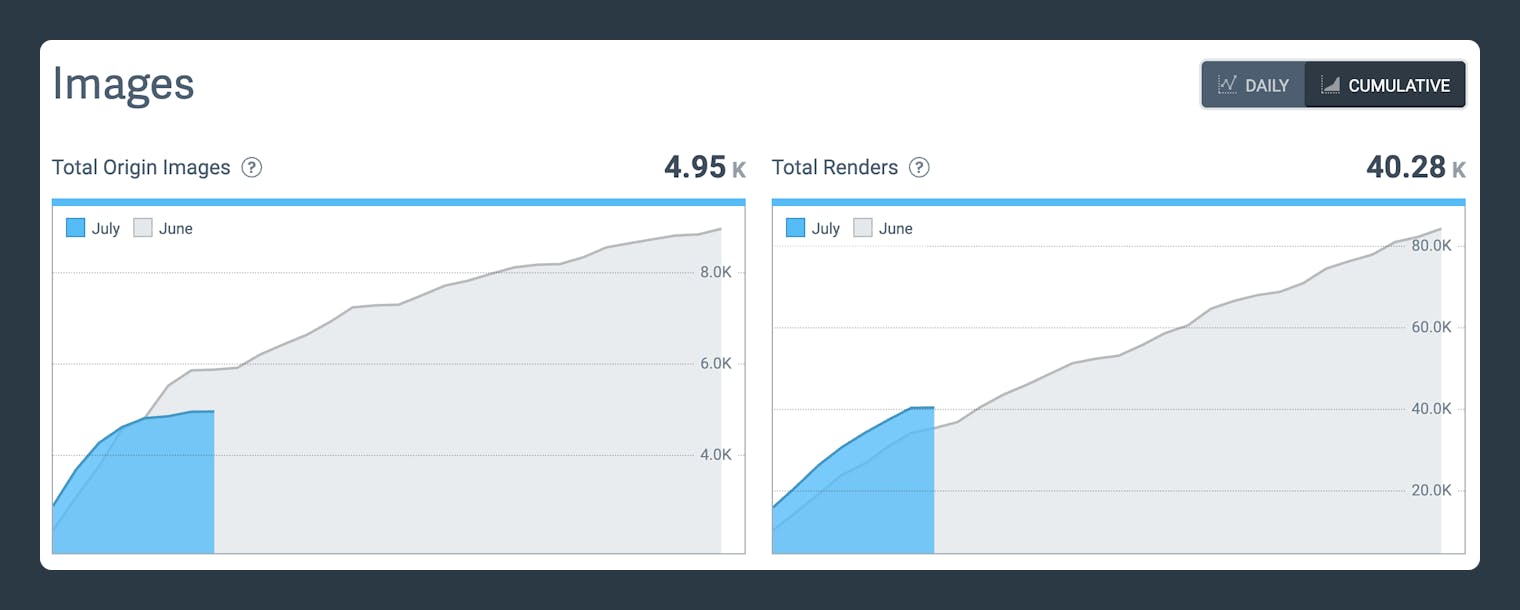
Origin Images vs. Renders
Origin Images are your original assets, stored on your servers or another web host such as Amazon S3. Renders (or derivative images) are the images we deliver to your users after our API parameters are applied via the rendering api. Each unique variation of an image counts as a render, so you should expect to see more renders than Origin Images, given that you may be delivering the same asset with different parameters depending on your user’s context.
Total Bandwidth
This includes the bandwidth to request the derivative asset from Imgix’s rendering engine into the CDN (Render Bandwidth), cache it, and then deliver the derivative from the CDN to the user (CDN Bandwidth). Fetch Bandwidth is tracked on this page but is not charged to your account.

Daily vs. Cumulative Stats
We provide two modes for displaying your monthly usage stats so that you have a clear picture of your usage at different levels of granularity: daily totals and day-over-day cumulative totals. Daily stats can show you where you have usage spikes throughout the month (helpful in tracking how your website changes affect usage), and cumulative stats show you the general trend of your usage from the beginning to the end of the month.

Error Calculation
We want only to log actionable errors in your analytics dashboard. As a result, errors are only recorded if the Origin image has been successfully requested at least once. If an Origin Image has never been successfully requested, we treat it as if it did not exist.
Additionally, we use de-duplication to ensure that the same error is not counted multiple times over a short period. For example, if a user receives a 404 and refreshes or requests the same image 10 times over a 5-minute period, it will only be logged as one error.
For more information on error status codes, see our HTTP status code documentation.
Video Analytics
If video is enabled for your Source, monthly stats for all videos served through Imgix using our Video API will be displayed. Analytics for video is broken down into Total Video Encoded, Total Minutes Encoded, Total Video Delivered, and Total Minutes Delivered.

Credits Analytics
The Credits tab in the Analytics dashboard shows your monthly credit consumption broken down by credit type. Like other analytics views, you can toggle between Daily and Cumulative modes, and each chart compares the current month against the previous month.

The six credit breakdowns are:
- Total Credits Used — Your overall credit consumption across all credit types
- Media Delivery Credits — Credits used to deliver images through Imgix’s CDN
- Media Management Credits — Credits used for asset management operations
- Standard Renders Credits Used — Credits consumed by standard render operations
- Advanced Renders Credits Used — Credits consumed by advanced render operations
- Premium Renders Credits Used — Credits consumed by premium render operations
For more on credit types and how they’re calculated, see Plan and Billing.
Audience Analytics
The Audience tab in the Analytics dashboard gives you a breakdown of who is requesting your images — by device type, operating system, browser, referrer, and CDN point of presence (POP). Like other analytics views, you can toggle between Daily and Cumulative modes to see either per-day totals or a running total across the month.
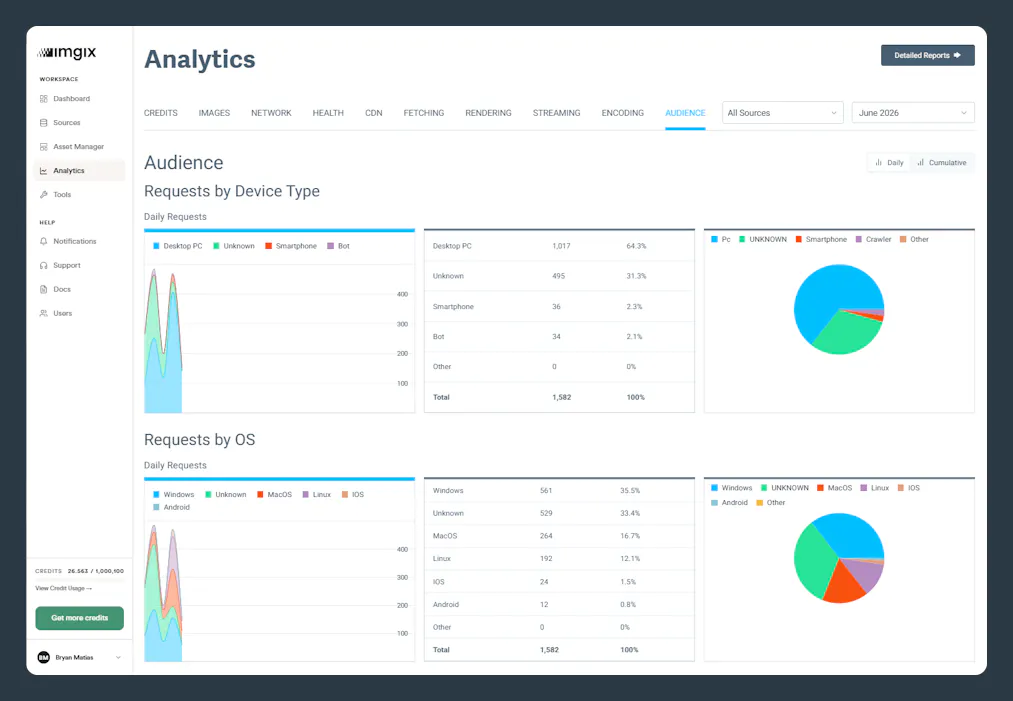
Each breakdown section shows a time-series chart, a data table with request counts and percentages, and a pie chart. The five breakdowns are:
- Requests by Device Type — Desktop PC, Smartphone, Bot, and Unknown
- Requests by OS — Windows, MacOS, Linux, iOS, Android, and Unknown
- Requests by Browser — Chrome, Firefox, Safari, Googlebot, Bingbot, Misc. Bot, and Unknown. Browser type is inferred from the user-agent sent with each request.
- Requests by Referrers — The domains referring traffic to your images. See Understanding User-Agents and Referers for more detail on how referer data is captured.
- Requests by POP — The CDN points of presence (e.g. MCI, RTM, CHI, IAD) serving your images
Downloadable Reports
If you are a Premium account with the Reporting API enabled, you can download a daily usage report in the Reports tab.

The report types and examples can be found below:
| Type | Description |
|---|---|
cdn_logs | Contains daily logs for requests made to our CDN for your images. Includes information such as referrers, user agents, cache hits/misses per image, and more. Example file For the referers and user_agent column, blank values indicate that there was no referer or user-agent data sent to Imgix. |
image_analytics | Contains metrics for each Origin Image accessed that day. Includes the number of requests and errors generated by each Origin Image URL. Example file. |
mild_errors | Contains data related to 4xx-level errors per image. Example file. |
source_analytics | Contains cumulative metrics for each Source. Includes information regarding total Origin Images, total bandwidth, average response times, and more. Example file. Since this report is cumulative, the report generated for July 31 will have Source analytics for that entire month. The report generated for July 15 will have the July Source analytics up to that day. |